来源:自学PHP网 时间:2015-04-14 14:51 作者: 阅读:次
[导读] 先看一下效果图:现在显示的是三条曲线,可以通过修改TipsChart js来实现线的条数,运用Ext,首先需要的就是引入Ext中的相关文件,这个就不提了,相信对Ext有所了解的都知道需要引那...
|
先看一下效果图:
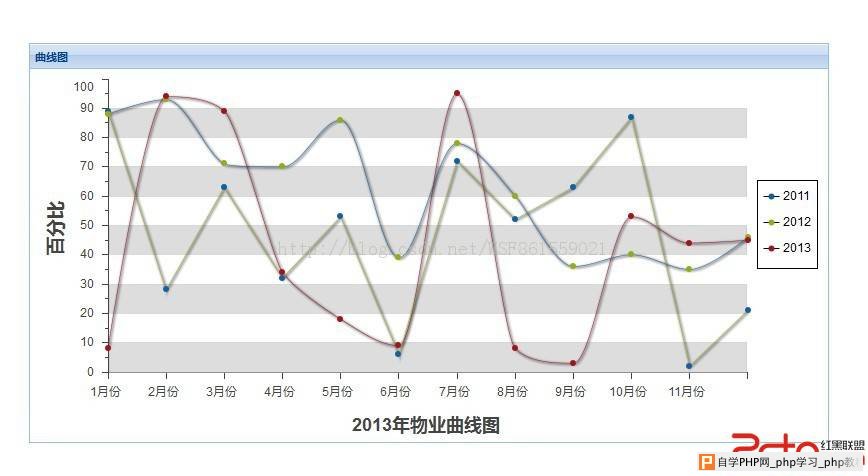 现在显示的是三条曲线,可以通过修改TipsChart.js来实现线的条数,运用Ext,首先需要的就是引入Ext中的相关文件,这个就不提了,相信对Ext有所了解的都知道需要引那几个文件
下面贴上代码:
index.jsp------------------------------
[html]
<%@ page language="java" import="java.util.*" pageEncoding="UTF-8"%>
<%
String path = request.getContextPath();
String basePath = request.getScheme()+"://"+request.getServerName()+":"+request.getServerPort()+path+"/";
%>
<!DOCTYPE HTML PUBLIC "-//W3C//DTD HTML 4.01 Transitional//EN">
<html>
<head>
<base href="<%=basePath%>">
<title>My JSP 'index.jsp' starting page</title>
<meta http-equiv="pragma" content="no-cache">
<meta http-equiv="cache-control" content="no-cache">
<meta http-equiv="expires" content="0">
<meta http-equiv="keywords" content="keyword1,keyword2,keyword3">
<meta http-equiv="description" content="This is my page">
<link rel="stylesheet" type="text/css" href="${pageContext.request.contextPath }/Ext/resources/css/ext-all.css" />
<link rel="stylesheet" type="text/css" href="${pageContext.request.contextPath }/Ext/resources/css/example.css" />
<style>
.x-tip {
background-color: #fff;
border-radius: 0.5em;
-moz-border-radius: 0.5em;
-webkit-border-radius: 0.5em;
border-radius: 0.5em;
border: 1px solid rgba(134, 84, 41, 0.5);
opacity: 0.95;
}
.x-tip-header {
margin-bottom: 5px;
}
.x-tip .x-panel .x-panel-body.x-layout-fit {
border: none;
}
.x-tip .x-panel.x-grid-section.x-panel-noborder.x-fit-item {
margin: 0;
}
.x-tip .x-panel.x-box-item {
top: 0 !important;
}
.x-tip-header-body .x-component.x-box-item {
width: 100%;
text-align: center;
}
.x-tip-body {
text-shadow: none;
}
.x-panel {
margin: 20px;
}
ul {
margin-left: 10px;
}
ul li {
display: block;
font-weight: normal;
color: #444;
padding: 2px;
}
h1 {
font-size: 18px;
margin: 10px;
}
</style>
<script type="text/javascript" src="${pageContext.request.contextPath }/Ext/bootstrap.js"></script>
<script type="text/javascript" src="${pageContext.request.contextPath }/Ext/example-data.js"></script>
<script type="text/javascript" src="${pageContext.request.contextPath }/Ext/TipsChart.js"></script>
</head>
<body id="docbody">
</body>
</html>
TipsChart.js
[html]
Ext.require('Ext.chart.*');
Ext.require('Ext.layout.container.Fit');
Ext.onReady(function () {
var panel1 = Ext.create('widget.panel', {
width: 800,
height: 400,
title: '曲线图',
renderTo: Ext.getBody(),
layout: 'fit',
items: [{
xtype: 'chart',
animate: true,
shadow: true,
store: store1,
legend: {
position: 'right'
},
axes: [{
type: 'Numeric',
minimum: 0,
position: 'left',
fields: ['2011', '2012', '2013'],
title: '百分比',
minorTickSteps: 1,
grid: {
odd: {
opacity: 1,
fill: '#ddd',
stroke: '#bbb',
'stroke-width': 0.5
}
}
}, {
type: 'Category',
position: 'bottom',
fields: 'name',
title: '2013年物业曲线图'
}],
series: [{
type: 'line',
axis: 'left',
gutter: 80,
xField: 'name',
yField: '2011',
markerConfig: {
type: 'circle',
'stroke-width': 0
}
},{
type: 'line',
axis: 'left',
smooth: true,
xField: 'name',
yField: '2012',
markerConfig: {
type: 'circle',
'stroke-width': 0
}
},{
type: 'line',
axis: 'left',
smooth: true,
xField: 'name',
yField: '2013',
markerConfig: {
type: 'circle',
'stroke-width': 0
}
}]
}]
});
});
其中Ext中自带的example-data.js文件我做了修改:
[html]
Ext.onReady(function() {
window.generateData = function(n, floor){
var data = [],i;
for (i = 0; i < (n || 12); i++) {
data.push({
name: i+1+'月份',
2011: Math.floor(Math.max(Math.random() * 100)),
2012: Math.floor(Math.max(Math.random() * 100)),
2013: Math.floor(Math.max(Math.random() * 100))
});
}
return data;
};
window.store1 = Ext.create('Ext.data.JsonStore', {
fields: ['name', '2011', '2012', '2013'],
data: generateData()
});
});
好了,所有代码已上传
|
自学PHP网专注网站建设学习,PHP程序学习,平面设计学习,以及操作系统学习
京ICP备14009008号-1@版权所有www.zixuephp.com
网站声明:本站所有视频,教程都由网友上传,站长收集和分享给大家学习使用,如由牵扯版权问题请联系站长邮箱904561283@qq.com