新手初识jpgraph肯定会遇到各种各样的问题,比如乱码什么的,本案例是jpgraph3.0.7制作,也经过本人的多次实验,解决乱码问题
复制代码 代码如下:
<?php
$datay=array(); //纵坐标数据
$datax=array(); //横坐标数据
foreach ($usernums as $key => $value){
$datay[] = $value;
$datax[] = $userids[$key];
}
require_once (‘jpgraph-3.0.7/jpgraph/jpgraph.php');
require_once (‘jpgraph-3.0.7/jpgraph/jpgraph_bar.php');
// Create the graph. These two calls are always required
$graph = new Graph(800,600); //图像高宽
$graph->SetScale(“textlin”);
$graph->xaxis->SetTickLabels($datax);
$graph->xaxis->SetFont(FF_VERDANA,FS_NORMAL,10);
$graph->xaxis->SetLabelAngle(30);
$graph->yaxis->scale->SetGrace(20);
$graph->xaxis->scale->SetGrace(20);
// Add a drop shadow
$graph->SetShadow();
// Adjust the margin a bit to make more room for titles
$graph->img->SetMargin(40,30,20,40);
// Create a bar pot
$bplot = new BarPlot($datay);
// Adjust fill color
$bplot->SetFillColor(‘orange');
$bplot->value->Show();
$bplot->value->SetFont(FF_ARIAL,FS_BOLD,10);
$bplot->value->SetAngle(45);
$bplot->value->SetFormat(‘%d');
$graph->Add($bplot);
// Setup the titles
$graph->title->Set(iconv(“UTF-8″, “gb2312″,”用户消费报表图”));
$graph->xaxis->title->Set(iconv(“UTF-8″, “gb2312″,”用户姓名”));
$graph->yaxis->title->Set(iconv(“UTF-8″, “gb2312″,”用户订单数量”));
$graph->xaxis->title->SetFont(FF_SIMSUN,FS_BOLD);
$graph->yaxis->title->SetFont(FF_SIMSUN,FS_BOLD);
$graph->title->SetFont(FF_SIMSUN,FS_BOLD);
// Display the graph
$graph->Stroke();
?>
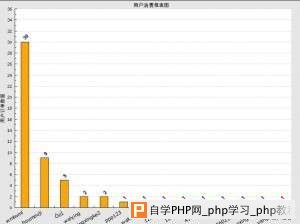
效果图:
官方网站 http://jpgraph.net/download/ 脚本之家下载地址 http://www.jb51.net/codes/38194.html
|
|